
Last updated: May 11, 2026
Quick Answer
Base44 is an AI-powered no-code platform that lets you build business dashboards through natural language prompts. Its dashboard performance is strong for small-to-moderate datasets (under 5,000 records), but load times increase noticeably beyond 10,000 records. For most small businesses and prototyping use cases, Base44 delivers real-time metrics including active users, error rates, and traffic data without writing code [10].
Key Takeaways
- Base44 dashboards work best with 2,000–5,000 records; performance degrades at 10,000+ records with 3–5 second load times
- Pricing starts at $16/month (annual billing), making it one of the more affordable no-code dashboard builders [1]
- The platform uses a credit system for AI interactions, which can drain quickly during iterative dashboard design
- Real-time metrics like active users, page visits, and custom events are built into the Traffic Overview dashboard [1]
- Community testing shows dashboards handle hundreds of concurrent users well, but pagination is recommended for scale [6]
- Competitors like Bolt.new, Lovable, and Bubble offer alternatives with different trade-offs in price, performance, and flexibility
- Base44 is better suited for prototyping and moderate-scale production than enterprise-level deployments
What Is Base44 Dashboard Performance and Who Is It For?
Base44 is a no-code platform that generates full-stack business applications from text prompts. Its dashboard functionality specifically targets business intelligence and analytics use cases, letting non-technical users create data visualizations, track KPIs, and monitor real-time metrics [8].
Choose Base44 dashboards if you:
- Need a working analytics dashboard in hours, not weeks
- Have datasets under 5,000 records
- Want AI-assisted layout and widget creation
- Don’t have a development team
Look elsewhere if you:
- Need enterprise compliance features
- Handle datasets exceeding 10,000 records regularly
- Require deep third-party integrations without credit limits
- Need guaranteed sub-second load times at scale
The platform’s customer insights tools let you track user behavior, segment audiences, and visualize trends without SQL or custom code [7]. For teams already exploring AI-powered content generation tools, Base44 fits naturally into an AI-first workflow.
How Does Base44 Dashboard Performance Compare to Alternatives?
Base44 sits in the middle of the no-code dashboard market: faster to build than most competitors, but with performance ceilings that more mature platforms don’t hit as quickly.
| Feature | Base44 | Bolt.new | Lovable | Bubble | Softr |
|---|---|---|---|---|---|
| Starting price | $16/mo | $25/mo | $25/mo | $29/mo | $49/mo |
| Build method | AI prompts | In-browser code | AI prompts | Drag-and-drop | Drag-and-drop |
| Best dataset size | 2K–5K records | 10K+ | 2K–5K | 50K+ | 10K+ |
| Credit/usage limits | Yes (message credits) | Token-based | Message-based | Workload units | None |
| Mobile app | Yes | No | No | Yes | Yes |
| Real-time analytics | Built-in | Custom | Custom | Plugin | Plugin |
Common mistake: Choosing Base44 solely on price without accounting for credit consumption. Dashboard iterations (tweaking layouts, adjusting queries, refining widgets) each consume credits, so the effective monthly cost can exceed the base subscription during active development.
Bolt.new gives you more code control and handles larger datasets, but requires more technical comfort. Bubble offers the most mature ecosystem for production dashboards at scale. For teams building no-code websites, Base44’s integrated approach may simplify the stack.
What Metrics Can You Track in Base44 Dashboards?
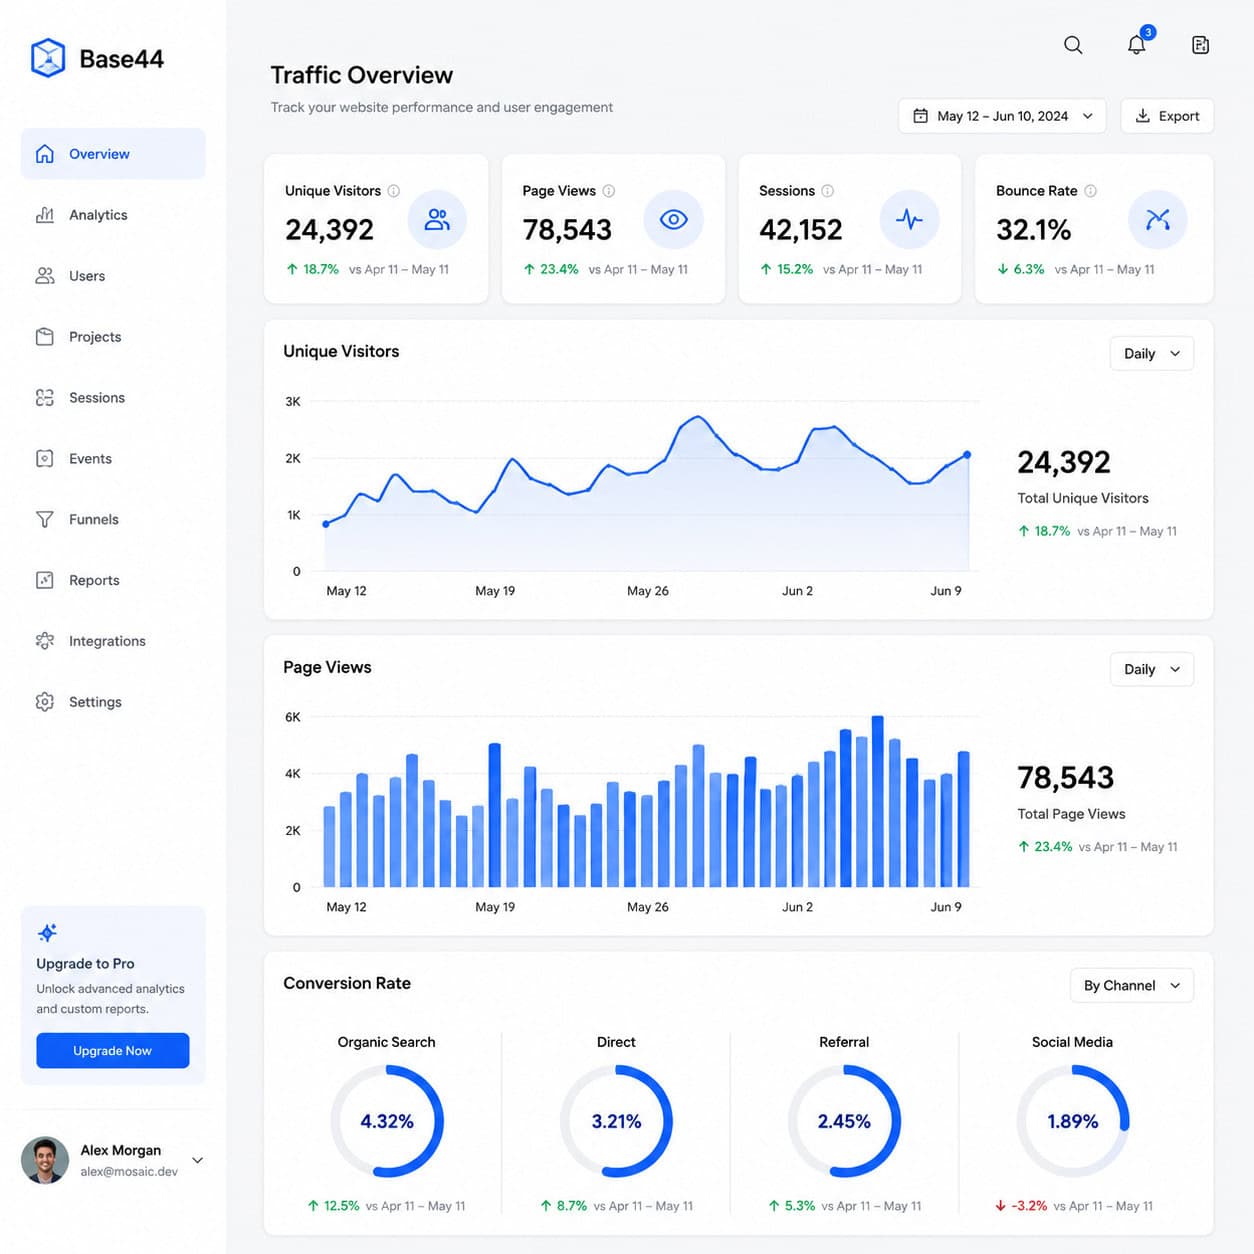
The built-in Traffic Overview dashboard provides core web analytics without additional setup [1]:
- Visits and page views — total and per-page breakdowns
- Unique visitors — deduplicated user counts
- Active users — real-time concurrent user monitoring
- Error rates — application-level error tracking
- Custom events — user-defined actions and conversions
Darrel Wilson’s January 2026 tutorial highlighted these real-time metrics as “valuable for data-driven decisions,” particularly compared to no-code rivals that lack built-in analytics entirely [10].
Best use case: Post-feature release analysis. After shipping a new feature, the dashboard shows immediate impact on user behavior, error spikes, and engagement changes without configuring separate analytics tools.
For teams focused on content performance optimization, Base44’s custom event tracking can measure content engagement directly within the app.
How to Optimize Base44 Dashboard Load Times
Base44 dashboards perform well at moderate scale but need optimization strategies as data grows. Here’s what works based on community testing and platform documentation:
Step-by-step optimization checklist
- Implement pagination — Break large datasets into pages of 50–100 records. Community members confirm this is the single biggest performance improvement for dashboards approaching 5,000+ records [6]
- Use filtered list views — About 80% of dashboard usage involves list views. Apply server-side filters to reduce the data loaded on each request
- Limit real-time widgets — Each real-time metric adds a persistent connection. Use 3–5 real-time widgets maximum per dashboard view
- Separate historical from live data — Move older records to archive views that load on demand rather than on page load
- Reduce custom event volume — Track only meaningful events. Every custom event adds processing overhead
Edge case: If your dashboard serves external clients (not just internal teams), expect performance to degrade faster because each client session maintains its own data connection. Reddit users report that hundreds of concurrent users work fine, but recommend load testing before launching client-facing dashboards [6].
Performance benchmarks (community-reported)
| Record count | Typical load time | User experience |
|---|---|---|
| Under 2,000 | Under 1 second | Smooth |
| 2,000–5,000 | 1–2 seconds | Acceptable |
| 5,000–10,000 | 2–3 seconds | Noticeable delay |
| 10,000+ | 3–5 seconds | Requires optimization |
These figures come from community testing and third-party analysis, not official Base44 benchmarks. Your results will vary based on query complexity and widget count.
What Are the Limitations of Base44 for Dashboard Performance?
Every platform has constraints. Being honest about Base44’s limitations helps you decide whether it fits your specific needs.
Credit system friction: Unlike flat-rate competitors, Base44’s message credit system means every AI interaction costs something. During dashboard development, you might use 20–30 credits refining a single view. This makes iterative design more expensive than it appears from the base price alone.
Scaling ceiling: Reddit discussions from early 2026 suggest Base44 is better positioned for prototyping than production at enterprise scale [6]. Users building for thousands of concurrent users should consider platforms with proven horizontal scaling.
Integration depth: While Base44 connects to common data sources, competitors like UI Bakery and Bubble offer deeper enterprise integrations (SSO, HIPAA compliance, custom API middleware) that Base44 hasn’t matched yet.
Decision rule: If your dashboard will serve fewer than 500 users with under 5,000 records, Base44 is a strong fit. If you’re building for thousands of users or need compliance certifications, start with Bubble or a custom solution.
For projects where the frontend design matters as much as the data, consider how design systems and UI kits can complement your Base44 dashboard’s visual layer.
How Does Unlocking Business Insights Work with Base44’s AI Features?
Base44’s core differentiator is AI-driven dashboard creation. You describe what you want in plain English, and the platform generates the dashboard structure, data connections, and visualizations [1].
What the AI handles well:
- Generating initial dashboard layouts from descriptions
- Suggesting appropriate chart types for your data
- Creating data models and relationships
- Building CRUD interfaces for data management
What still needs manual work:
- Fine-tuning performance for large datasets
- Custom styling beyond default templates
- Complex conditional logic in widgets
- Multi-step data transformations
The April 2026 platform update included general AI upgrades and workspace tools, though no dashboard-specific performance improvements were announced [1]. The mobile app (updated April 28, 2026) maintains the same AI-powered creation workflow on mobile devices.
A May 2026 YouTube review confirmed that Base44’s credit system and integrations remain the key factors for dashboard performance in app building, with smooth operation reported for standard business applications [2].
Teams already using AI tools for website building will find Base44’s prompt-based approach familiar. The learning curve is minimal if you’re comfortable describing what you want rather than building it manually.
When Should You Choose Base44 Over Building Custom Dashboards?
Direct answer: Choose Base44 when speed-to-insight matters more than infinite customization, and when your data volume stays under 5,000 records.
Base44 wins when:
- You need a dashboard this week, not next quarter
- Your team lacks frontend developers
- The data source is straightforward (single database, simple API)
- You’re validating a business idea before investing in custom development
Custom development wins when:
- You need sub-200ms response times
- Data volume exceeds 50,000 records
- Compliance requirements (SOC 2, HIPAA) are non-negotiable
- You need pixel-perfect brand consistency
One Reddit user documented their journey making Base44 their full-time platform, noting that the speed of iteration offset the platform’s limitations for their use case [9]. This aligns with the general community consensus: Base44 excels at getting from zero to functional dashboard faster than any alternative.
For those building complete web presences alongside dashboards, understanding SEO performance optimization ensures your public-facing pages perform as well as your internal analytics.
Conclusion
Base44 Dashboard Performance delivers genuine value for teams that need business intelligence without development overhead. The platform’s sweet spot is clear: moderate datasets, small-to-medium teams, and use cases where speed of deployment outweighs raw performance at scale.
Your next steps:
- Start with the free tier to test dashboard creation with your actual data
- Monitor credit usage during your first week — if you burn through credits quickly, factor that into your budget
- Implement pagination from day one if your dataset might exceed 2,000 records
- Set up the Traffic Overview dashboard immediately for baseline metrics [1]
- Plan your scaling strategy before you hit 5,000 records — know whether you’ll optimize within Base44 or migrate to a more scalable platform
The platform continues to improve (the April 2026 AI upgrades suggest ongoing investment), but make your decision based on current capabilities, not roadmap promises. For most small business analytics needs in 2026, Base44 dashboards deliver insights fast enough and affordably enough to justify the trade-offs.
FAQ
How much does Base44 cost for dashboard features? Plans start at $16/month with annual billing. All plans include dashboard creation, but AI interactions consume message credits that may require higher-tier plans for heavy dashboard iteration [1].
Can Base44 dashboards handle real-time data? Yes. The built-in Traffic Overview tracks active users, visits, and custom events in real time. Performance remains smooth for moderate concurrent user counts (under 500) [10].
What’s the maximum dataset size Base44 handles well? Community testing shows smooth performance up to 5,000 records. Beyond 10,000 records, expect 3–5 second load times without optimization like pagination and filtered views [6].
Is Base44 suitable for client-facing dashboards? For small client bases (under 100 concurrent users), yes. For larger deployments, test thoroughly and implement pagination. Some community members suggest it’s better for internal analytics than external products [6].
How does Base44 compare to Bubble for dashboards? Bubble offers more mature scaling, deeper integrations, and a larger plugin ecosystem. Base44 is faster to build with (AI prompts vs. drag-and-drop) and cheaper at entry level. Choose Bubble for enterprise scale; choose Base44 for speed.
Does Base44 have a mobile dashboard app? Yes. The Google Play listing was updated April 2026 with AI-powered dashboard creation capabilities for mobile use [1].
What are Base44’s main competitors for business dashboards? Bolt.new ($25/mo, more code control), Lovable ($25/mo, clean AI output), Bubble ($29/mo, mature ecosystem), and Softr ($49/mo, Airtable-native). Each trades off differently between speed, scale, and price.
Can I export data from Base44 dashboards? Base44 supports data export, though the format options are more limited than enterprise BI tools like Tableau or Power BI. Check current documentation for specific export formats available on your plan.
How long does it take to build a dashboard in Base44? A functional dashboard with 5–8 widgets can be created in 30–60 minutes using AI prompts. Refinement and optimization typically adds another 2–4 hours depending on complexity.
Does Base44 support custom events for tracking? Yes. You can define custom events beyond the default traffic metrics, allowing you to track specific user actions, conversions, and business-specific KPIs [1].
References
[1] base44 – https://base44.com [2] Watch – https://www.youtube.com/watch?v=FN9fyZ9IPWs [6] Scaling With Base44 Realworld Performance At – https://www.reddit.com/r/Base44/comments/1r7hr4e/scaling_with_base44_realworld_performance_at/ [7] Customer Insights – https://base44.com/use-cases/categories/business-intelligence-and-analytics/customer-insights [8] Business Intelligence And Analytics – https://base44.com/use-cases/categories/business-intelligence-and-analytics [9] B44 Partner Journey How Base44 Became My Fulltime – https://www.reddit.com/r/Base44/comments/1sez69b/b44_partner_journey_how_base44_became_my_fulltime/ [10] Watch – https://www.youtube.com/watch?v=g6MRoCtJOLc